Capturing performance metrics on Analytics Engine machines for Shinydocs Support
When running the Analytics Engine on a single node or in a cluster, there may come a time where the performance of the cluster/node needs to be analyzed by Shinydocs Support. Windows has a built-in performance monitor that is useful to use along with VM host-level performance metrics. This guide will show you how to capture these metrics to send to Shinydocs.
What is needed?
Windows OS
Preconfigured Data Collector Set template
The preconfigured Data Collector Set template can be downloaded here:
SHA-1: 68536146324657EC74AF9A3ADDAD90D2CF84E99F
What is recorded?
This perfmon or Performance Monitor template is configured to log the following metrics:
\Memory\Available MBytes
\Memory\Pages/sec
\Network Adapter(*)\Bytes Total/sec
\Processor Performance(*)\% of Maximum Frequency
\System\Processor Queue Length
\Processor(_Total)\% Processor Time
\LogicalDisk(*)\*
\Paging File(*)\*
\PhysicalDisk(_Total)\*
Setup Steps
After downloading ShinyPerfmonConfig.xml, copy it to the machine(s) you need to capture performance metrics on.
Open Windows Performance monitor
Windows Key + R → perfmon → OK
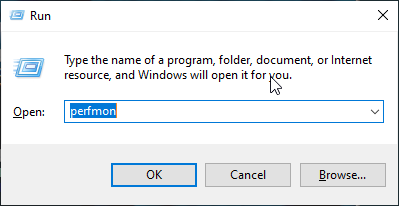
Windows Run
With Performance Monitor now open, click to drop-down Data Collector Sets
Right-click User Defined > New > Data Collector Set

Give the collection a name and check “Create from template (recommended)”, click Next

On “Which template would you like to use”, click Browse → find “ShinyPerfmonConfig.xml” and click Open

Click Next
Specify where the logs will be saved and click Next
You can change the “Run as” user if needed. You would likely only need to change this if there are special restrictions on your account that would prevent you from capturing these metrics
Select “Save and close” and click Finish
Capture Steps
Once setup has been completed on each machine, you can start capturing the data.
In Perfomance Monitor, select Data Collector Sets > User Defined > ShinyPerformanceMonitor
Prepare to run necessary tests to capture performance metrics
Click the Play button in the toolbar

Metrics recording has begun! Now, start your testing!
To stop the collection (after at least 10 seconds), click the stop button in the toolbar

Report Steps
Once you have collected the data from previous steps, you are now ready to review and send a copy of the data.
In Perfomance Monitor, click to drop down Reports
Click to drop down User Defined and click on ShinyPerfoamanceMonitor. You will see the available reports from this data collection set on the right panel. The first part of the name will be the machine’s name
Double click the report to view the data

When ready to send data to Shinydocs, right-click on the report in the file tree in the left panel > view > folder
The ShinyPerfmon.blg file will now appear in the right panel. This file can be copied to wherever you need to upload the file to Shinydocs Support