Initial Discovery - File Share
Crawling a File Share for Metadata
The most efficient and effective data management strategy begins with data discovery. The Shinydocs Cognitive Analysis Toolkit allows you to perform a metadata crawl of any data repository, such as a file share, to extract the who, what, where and when of all your data. All this business-critical information is stored in the Shinydocs Index.
Did you know… The Shinydocs Index stores extracted metadata to be included in visualizations and search results. |
Crawl Your Data
Before you begin, ensure that the Shinydocs Cognitive Analysis Toolkit has been installed and activated. If not, refer to thehttps://enterprisefile.atlassian.net/wiki/x/eYBuNw for installation instructions. Refer to https://enterprisefile.atlassian.net/wiki/x/LoR7Ng to activate your license.
DO:
Crawl using the file share network (or UNC) path(s), for example: \\server_name\share_name
DO NOT:
Crawl the file share using a mapped drive letter in the path, for example: \\c:\department\finance
Note: As IP addresses may change, we do not recommend using the file share machine’s IP address in the UNC path to be crawled.
Step by step:
Open a Windows command prompt as Administrator or as the Service Account that has Read access to the file share.
Change directory (cd) to where you extracted the shinydocs-cognitive-toolkit-yyyy-mm-dd.zip file
Run the command for a file share metadata crawl: CognitiveToolkit.exe CrawlFileSystem --path <PATH> --index-server-url <INDEX_SERVER_URL> --index-name <INDEX_NAME>
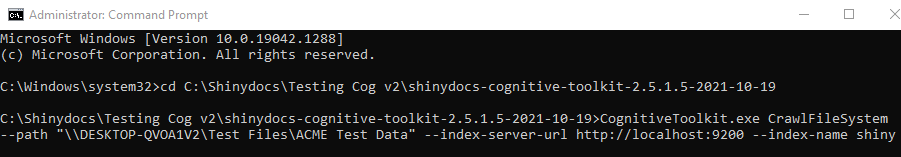
*Example of a command used to perform a crawl of a shared folder, which will store the file metadata in the Shinydocs Index, called shiny.
When the DOS > prompt is displayed, your crawl is complete. The metadata information is recorded in the Shinydocs Index.
Did you know… There are two ways to run tools in the Shinydocs Cognitive Toolkit:
|
Visualize Your Data
Before you begin, ensure that the Shinydocs Indexer/Visualizer has been installed. If not, refer to the https://enterprisefile.atlassian.net/wiki/x/eYBuNw instructions.
Once installed, the Visualizer will require additional setup steps. Refer to https://shinydocs.atlassian.net/wiki/spaces/SHINY/pages/2468642864 for these details.
In a Web Browser (Chrome is recommended), enter the address for where Shinydocs Analytics has been installed. This is typically <machine-name>:5601. If you are running the tool locally, use "localhost:5601".
From the Dashboard menu, open the basic dashboard for displaying metadata information: Base - Metadata
On this dashboard you will see a number of visualizations, each of which are based on a query of the underlying Shinydocs Index.
The visualizations on this Dashboard include the following:
Total Number of Files
Total Storage
Storage by Document Group & Type
Number of Files by Document Type
Number of Files by Created Date
Number of Files by Last Modified Date
Number of Files by Last Accessed Date
File Listing by File Size
File Listing by Name
Customize Your Data
Filters can easily be applied by the "Add a filter +" link near the top of the page.
Alternatively, click on an item to display information related only to that item. For example, find the "Storage by Document Group & Type" visualization. Hovering over various parts of the visualization, will display the filter that will be applied by clicking on that particular section.
To apply the filter that will display only Microsoft Office Documents, click on the "Microsoft Office Documents" part of the pie chart (assuming some were crawled).
Once a filter has been applied, it can be removed by clicking the "Remove filter" icon near the top of the page.
Preset Filters
It is a good rule of thumb to keep business documents and financial records for a period of 7 years in compliance with the many business standards. For that reason, we’ve created 3 filters for displaying documents that were either created, modified or accessed in the past 7 years.
You will find these filters are easily accessible at the top of most Dashboards. The filters remain inactive (as indicated by the background striping) until manually enabled.
To enable a filter, use the cursor to hover over it. For example, hover over the Created in Past 7 years filter. Click Enable filter.
When enabled, the filter background will be solid and your dashboard will only display analytics for data created in the past 7 years.
To disable the filter and return it to an inactive state on the dashboard, use the cursor to hover over the filter. Click Disable filter.
To delete the filter from the dashboard, use the cursor to hover over the filter.
Click Remove filter.
Act on Your Data
The metadata crawl of a file share logs valuable information in the Shinydocs Index that can be acted upon in a number of ways. Typical actions include:
Visualization | Discovery | Actions |
Number of Files by Document Type This pie chart lists (by file extension) the 500 files found in the Shinydocs Index using the largest amounts of storage. | Check for file extensions that are no longer used. Check for files, by file extension, that are taking up an abnormally high amount of storage. *To investigate further, use filters to drill into this data. | Classify as ROT
|
Number of Files by Document Type This pie chart lists the 500 most common files by extension (ie .txt for a text file) found in the Shinydocs Index. | Check for abnormally large numbers of files that may be unexpected for the file share crawled. *To investigate further, use filters to drill into this data. | Classify as ROT
|
Number of Files by File Size This horizontal bar graph lists, in descending order, the largest 50 files found in the Shinydocs Index. | Check for files that may be obvious candidates for deletion, like an old backup file that is no longer needed. *To investigate further, use filters to drill into this data. | Classify as ROT
|
Number of Files by Created Date Number of Files by Last Modified Date Number of files by Last Accessed Date These vertical bar graphs list the number of files found in the Shinydocs Index by date they were made; date they were last edited; and, date they were last ‘touched’, respectively.
| Check for unexpected values by selecting a date range in the visualization. The easiest way to do this is by dragging a box over the desired area. This will apply a filter based on your selection. For example, files created over 7 years ago may pose a compliance concern; or files that have not been accessed in over 3 years may be outdated or unnecessary. *To investigate further, enable one of the included filters at the top of the page. You can also exclude results based on these filters as well. | Classify as ROT
|