Changes when using Elasticsearch and Kibana 6.8.23 (Free Tier) instead of Shinydocs Indexer and Visualizer 6.8.23
Powered by Elasticsearch and Kibana
What’s New?
The UI in the Visualizer is now Kibana’s UI
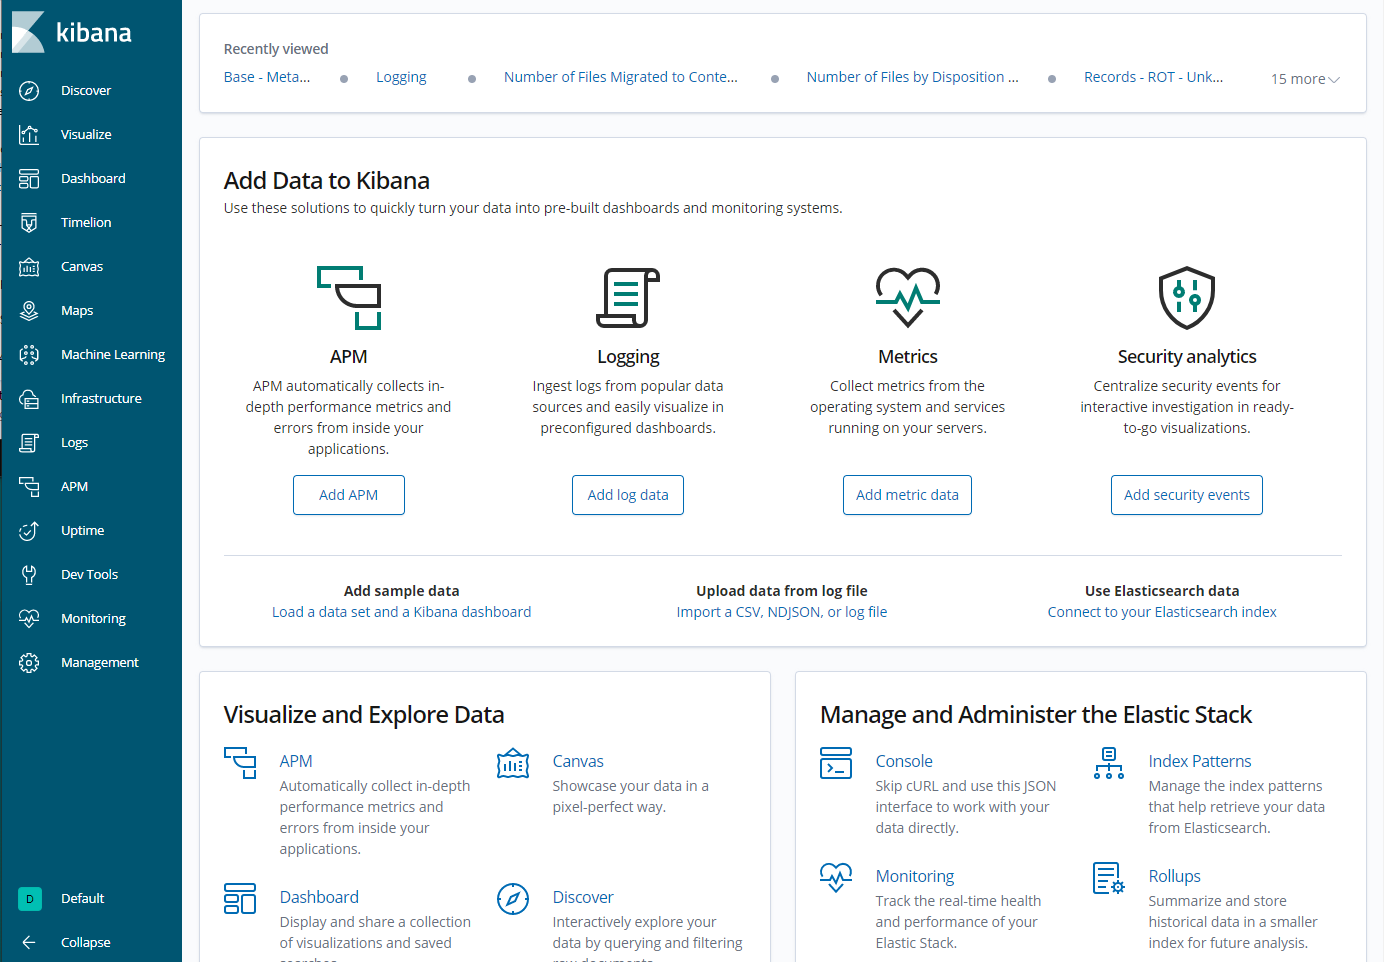
Visualizer/Kibana 6.8.23
You will notice some new options in the left-side navigation pane. The same pages exist from previous versions, and also include Elasticsearch's other tools, however, they are not officially supported by Shinydocs at this time, including:
Canvas
Maps
Machine Learning
Infrastructure
APM
Uptime
User Accounts
Monitoring is now included in Kibana
Monitoring needs to be enabled
Click on the “Monitoring” tab on the left-side navigation pane to enable
By default, it will keep monitoring data for 2 weeks (14 days)
The monitoring tool is very useful for getting metrics on the performance of the cluster. For more information please see https://www.elastic.co/guide/en/kibana/6.8/elasticsearch-metrics.html
Are there any breaking changes?
No! Everything you were used to doing in Kibana and Elasticsearch is the same as it was in previous versions. If you would like to get into the finer details, check out Elasticsearch’s release notes here:
Elasticsearch: https://www.elastic.co/guide/en/elasticsearch/reference/6.8/es-release-notes.html
Kibana: https://www.elastic.co/guide/en/kibana/6.8/release-notes.html
Are there any other changes I should know about?
Yes! When installing 6.8.23, there are some additional configurations required when setting up the Indexer/Elasticsearch.
You will still need to configure the Java heap settings in the jvm.options file as normal
The following configurations are located in the elasticsearch.yml file located in ..\indexer\config
Line 17 -
cluster.nameRemove the comment character
#at the beginning of the lineReplace
my-applicationwith a name for your cluster (e.g.acme-analytics)This name will need to be the exact same on every node in the cluster
Line 23 -
node.nameRemove the comment character
#at the beginning of the lineReplace
node-1with a unique name for this machine. This will be the name reported on the Monitoring page of Kibana. Using the server's name is a good choice!
Line 43 -
bootstrap.memory_lockRemove the comment character
#at the beginning of the lineKeep the value
true
Line 55 -
network.hostRemove the comment character
#at the beginning of the lineGenerally, the easiest value to set
network.hostto is0.0.0.0meaning that it will bind on all network interfaces on the machine. For more details see https://www.elastic.co/guide/en/elasticsearch/reference/6.8/network.host.html#network.host https://www.elastic.co/guide/en/elasticsearch/reference/6.8/network.host.html#network.hostIf this line is not modified, the index and Kiabana will not be accessible outside of the local machine
If you are configuring a cluster of servers, please see our guide Setting up clusters for Analytics Engine (Shinydocs Indexer)
Save the file and restart the Shinydocs Indexer service for your changes to take effect
Elasticsearch is a trademark of Elasticsearch BV, registered in the U.S. and in other countries
Kibana is a trademark of Elasticsearch BV, registered in the U.S. and in other countries.