A popular request with the Shinydocs Visualizer is to display the totals or sums of each crawled file share that is contained within one index. If that sounds good, you have come to the right place! This is easy to achieve in the Visualizer with some simple configuration, best part is, this will not have an impact on your index! This “new field” is used in the visualizer only, no need to worry about accidentally tagging, running extra processes, or waiting.
This new field is for visualization purposes only. These fields cannot be used for search.
1. Set up the “scripted field” for the index of your choice
-
Open the Shinydocs Visualizer in your web-browser
-
Select Management > Index Patterns
-
Select the index you will apply this to (you can use an aggregate index as well)
-
Select the tab “Scripted fields” > Add scripted field
-
Enter the following configuration
-
Name: Share Name
Note: You MUST use this name if you intend to use the paired visualization in this article -
Language: painless
-
Type: string
-
Format: - Default -
-
Popularity: 1
-
Script:
Javaif (doc['path.keyword'].value != null){ def m = /(\\\\[a-zA-Z0-9|a-zA-Z0-9 |a-zA-Z0-9_]+\\[a-zA-Z0-9|a-zA-Z0-9 |a-zA-Z0-9_]+).*/.matcher(doc['path.keyword'].value); if ( m.matches() ) { return m.group(1) } else { return 'Unexpected path (likely not a UNC path)' } }
-
-
Save Field
-
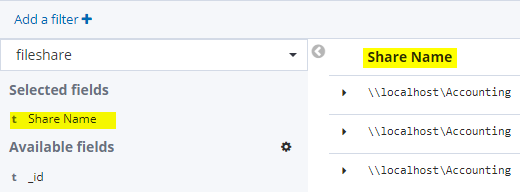
You will now notice in the Discover tab, there is a new field called “Share Name” and it contains the machine and name of the share!
2. Set up the visualization
Import our pre-configured visualization into the Shinydocs Visualizer.
-
Download the file on this article (bottom of the article)
-
Open the Shinydocs Visualizer in your web browser
-
Select Management > Saved Objects
-
Select “Import”

-
In the newly opened panel, select “Import”

-
Select “ShareNameDataTable-Visualization.json” from your download location
-
Select “Import” at the bottom of the panel

-
In the “Index Pattern Conflicts” panel, select the index you want the visualization to be paired with from the dropdown menu.
-
Select “Confirm all changes”
-
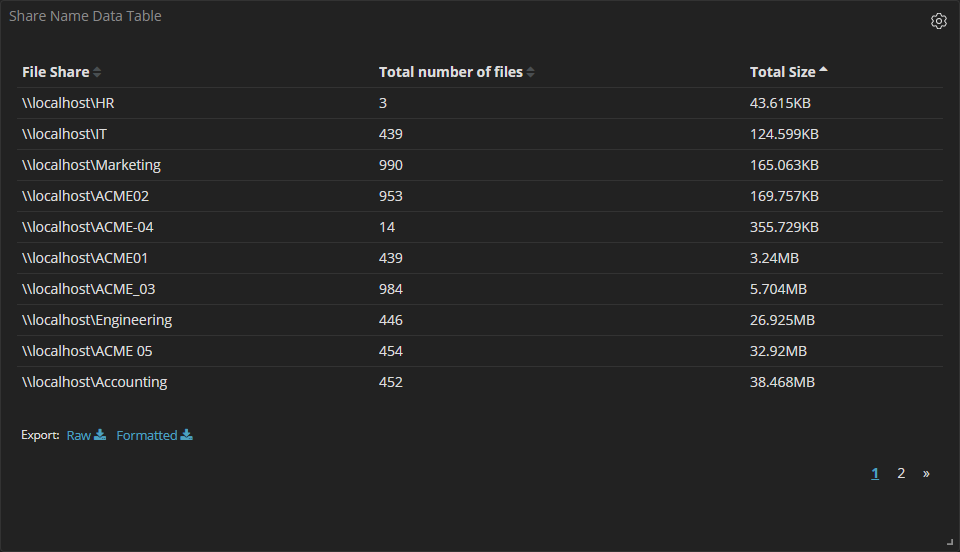
Now you can add this visualization to any of your dashboards, or make a new dashboard!
Attachments
ShareNameDataTable-Visualization.json