The overview page is the high-level view of your content. Overview displays all your analyzed data at a glance, giving you instant insights into your content.
From here, you can see:
-
Total items crawled.
-
Total size of items crawled.
-
Duplicates versus unique items.
-
How many and how much redundant, obsolete, and trivial data exists overall.
-
How many items contain personally identifiable information (PII) by severity.
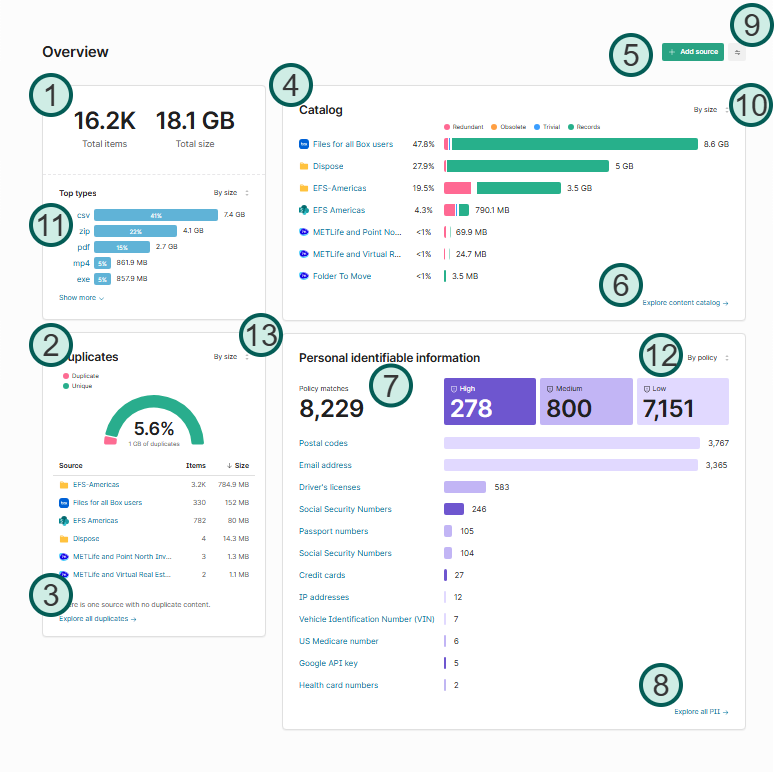
Points of interest
|
1 |
Data totals |
Total number of items and size of all crawled data. |
|
2 |
Duplicates versus unique items |
How many true, binary duplicates exist in your data versus unique (non-duplicated) files. |
|
3 |
Explore all duplicates |
Opens the Data catalog view to explore your duplicate items. |
|
4 |
Catalog |
Simplified view of files that would be considered records, redundant, obsolete, or trivial. |
|
5 |
+ Add source |
Add a new source to Shinydocs Control Center for analysis. |
|
6 |
Explore content catalog |
Opens the Catalog to explore all your data. |
|
7 |
Personal identifiable information (PII) |
Overview of items that potentially contain PII. There are three categories based on importance. |
|
8 |
Explore all PII |
Opens the Data catalog view to explore all your data that may contain PII. |
|
9 |
Display options |
Opens Overview display options |
|
10 |
Visualization options |
Each visualization has these options, allow you to change the visualization by source or other ways depending on the visualization. |
|
11 |
Top types |
Shows a breakdown of the most common document types under analysis in Shinydocs Pro. |
|
12 |
PII options |
Change the view of PII between by policy and by source. |
|
13 |
Duplicates options |
Change the view of duplicates by size or by count. |